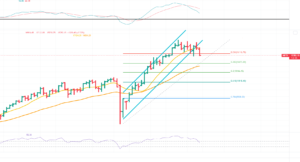

Historical PE
Other aspect we looked at historical NIFTY PE chart.
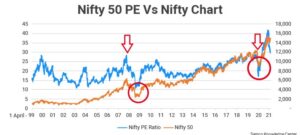
FII Support -Possible ?
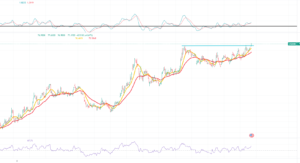
Stage Analysis – DOW, NASDAQ ,NIFTY 50
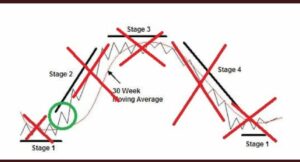
Stage Analysis is a technique that helps an individual investor to enter and exit his/hers long term holdings.
It is based on the moving average of 30 Weeks.
The following picture gives summary of Stage Analysis Method.
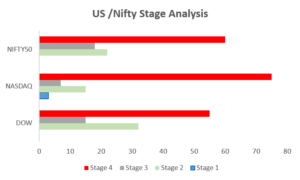
As per this analysis , the situation of NASDAQ , DOW and Nifty 50 does not look good. Maximum % of stocks are in Stage 4 (declining phase) . For example ,Nifty 50 has more than 70% stocks in Stage 4.
In all 3 Indexes,one can see that maximum % of stocks are in Stage 4- a clear sign of a bear market.
Macro View -US -Mother of All Markets.
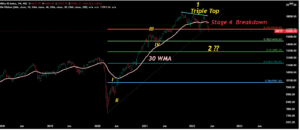
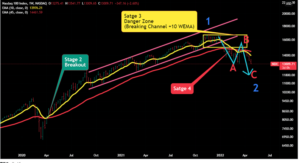
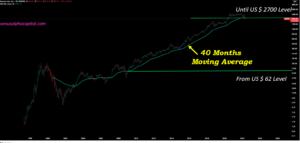
Nasdaq – In Satge 4 . Breaking 40 months moving average after 13 years.
From EW prespective it is in Wave 2. Expect a bounce in coming weeks and then a deeper plunge.
Amazon -similar story
US Inflation -The Joker in the Pack
Us Inflation is moving higher – highest in the decades.
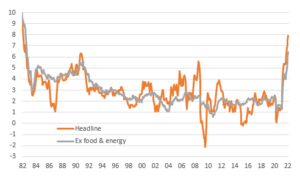
US Fed is trying hard to control inflation by raising interest rates – thus sucking liquidity from all capital markets. The risk is recession in US but it seems Fed has accepted that reality – now fight is between mild-recession or severe recession.
Also US FED wants to saves its Bond market in lieu of its issues with Russia and China – and wants people to buy its bonds ( by creating fear around equity). And it seems to be succeding.
As of now it seems that FED is not reversing its stated policy.
Till the time it does not reverse, very less hope for global equity markets- the butterfly effect
You can read Fed Chair Powell interview by clicking here. https://www.marketplace.org/2022/05/12/fed-chair-jerome-powell-controlling-inflation-will-include-some-pain/
Hangover Effect of Heady Cocktail (Nasdaq+Fed+Inflation)
In the past whenever US markets fell, US FED came to help as some of the public is invested in stocks so it wanted to save them.
But look at the inflation chart and the following chart …in the past when FED came to help by decreasing interest rates by doing QE ,in those years inflation was not an issue.
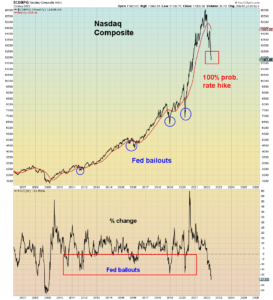
But this time -दोस्त (FED) खुद ही मुश्किल में है. Political bosses want Fed to focus on inflation-control as otherwise they may loose votes.
Now with these rates hikes by FED, US inflation is yet to come under control but all emerging markets are falling .
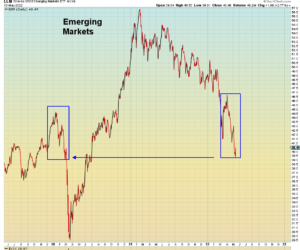
Because :
a) Currencies of EMs are depreciating, FIIs fear that they would fall more due dollar strength so they are selling out in all emerging markets.
b) Various foriegn nations and companies have dollar denominated debt, with falling currencies their debt level as well as interest payouts are going up mthus affecting the whole valuations models
c) To fight currency depreciationtion as well as to fight infla, Central Banks (including ours, RBI) of almost all the countries are increasing interest rates. Increased interest rates means lower demand and higher interest cost for the companies – so impact on revenue as well as earnings.
The vicious cycle is on.
Summary – it is a bit depressing picture. Hopefully we would do better than this and there won’t be any doomsdays.
If the worst comes, how It would play out?
No market moves in a straight line .
Here are the 2 of the several likely paths to the downside.
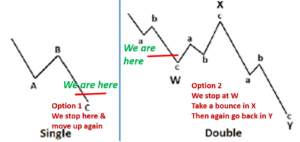
Path 1 – We stop at 15671 -March lows
Path 2– We stop near 14400-450 levels (W) , bounce back in X and then again plunge upto level Y
Path 3 – And if market wants move towards 11900 & beyond, then it can bounce back in X again (after Y ) and go upto Z as a final move.
Disclaimer: This is one sided view of the markets. Market may behave very differently than discussed above. Use your own discretion to make your investment decisions. Take every opinioon with pinch of salt.
9 claps




Very insightful observations .
Thanx to the team for being prepared for such a steep fall in coming times.
This is extremely insightful. Thanks for your research and enlightenment.