If you’re buying the dip in this fall , then you might be doing a mistake.
In this article ,we discuss about the Stage Analysis technique and how it can help medium to long term investors for timing of their entry and exit price points in their equity-investment journey.
This strategy is in contrast with very common investment approach that advocates ‘Buy-low ,Sell high’. This strategy favors ‘Buy -high ,Sell-high’ .
Basic Principles :
This strategy is based on 2 principles :
A) It is difficult to gauge the extent of the fall/rise in any stock-price .No-one can know in advance the extent of fall or rise in the price .Market can be irrational on both extremes.
B) Other key consideration is timing. The stock-price of a company can linger in certain price-range for weeks ,months or years. This results in loss of your potential gain from other alternatives when one alternative is chosen and that does not giving any returns (opportunity cost ).

One of the objectives of this analysis is to find and ride on a certain stock when instituational investors or HNIs are entering a stock . This is becaue, in most of the cases a stock can not go up unlesss big hands show intrest in it and buy it in good volumes.
On the other hand, it also helps in identifying the stocks where big hands are exiting and one can try to time his exit near to those price-points. This is because when big hands are exiting and there is no one to support the price of a stock, then the price can fall to any levels.
Key Components of Stage Analysis
The quicker you want something,the easier you are to manipulate.
To succeed in markets, one needs to patient and this apporach helps you to be patient and to overcome short-term temptations .
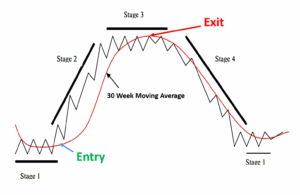
Stage Analysis consists of 4 stages – Satge 1,2,3,4 . The basic premise is to buy a stock when it is starting its stage 2 and exit when it enters in stage 4. You would know more about these stages as you read forward.
Basic Requirements :
To work as per this strategy , you need to familiarize yourself with the charts of the stocks-prices that you find interesting.
These charts are easily and freely available .Either you can use your broker’s website or you can use TradingView.com or Investing.com .
Once you know , how to open and see the charts , here are some additional requirements for stage analysis :
Weekly Chart – Stage Analysis requires you to work on weekly charts. since the system is designed to be for medium to longer term investments, from weeks to months to years at a time. Stage Analysis is not a system for day trading.
30-Week Moving Average WMA) – The price action on the weekly chart is compared in relation to the 30-week moving average in order to identify the specific stage of the stock.
One needs to check the weekly closing price in comparison to 30 week moving average (WMA) price. Whether price is higher /lower or sideways in relation to 30 WMA, will tell you the stage of the stock.
Volume – A key component of this stratgey is to keep an eye on volume.The transition from one stage to another requires a big increase in volume .
The following picture is to help novices who are first time oening the chart.
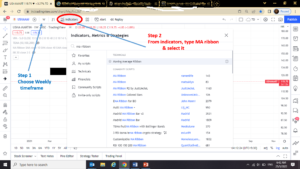
1. Choose weekly chart
2. From indicators , choose MA Ribbon and once you’ve indicator on your chart, only keep one moving average – 30 , close the rest.
3. Also find volumes from indicators and select.
Stages in the Life of a Stock:
Once you have the basic knowledge of charts and moving averages , it is very easy to identify the stage of a stock. As mentioned before , a stock can be in either of 4 stages based on 30 WMA.
Stage Analysis uses 4 distinct stages that a particular stock can be in. The stage, and transitions between stages, have specific guidelines for whether an investor should buy, sell, or hold that particular stock.
The following picture can help you to detemine the stage.
Stage 1: Basing Stage
A base is simply a period where the stock moves mostly sideways instead of trending up or down. A base can be formed after a rise or decline in the stock price.
in Stage 1, the stock forms a long horizontal base . The longer the horizontal base the better. A long base establishes a more significant support level, as the ownership of the stock will transfer from weak hands to strong hands because weak hands might have exited the stock either due to price -correction or by getting frustrated due to no price movement.
While forming a Stage 1 base, price action usually oscillates above and below the 30-week moving average .
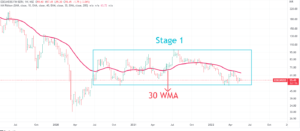
The above example is of Edelwiess Finacial Services.
The stock price is in Satge 1 and is hovering between INR 50 and INR 100 for last two years and has not participated in post-Covid fall bull run. The price just keeps moving up and down of 30 WMA and is not showing any siginificant strength.
What you should do in this stage:
1) Just in Watchlist : No action required in this stage, just keep a close watch and note down the price when they’re likely to breakout into a Stage 2 advance (refer to Stage 2).
Do not take a position in this stock in this stage . The stock can continue to be in the Stage 1 for months to years (like in the above example of Edelweiss). Your capital will be tied up as stock will go nowhere and would keep resting in this base for a long period of time.
2) Sector Watch :Stocks tend to move in a herd . Take a look at the sector the stock is in and see if the entire sector is also in the same stage. This will help in validating the stage at the time of breakout into Stage 2 . If the entire sector moves with your stock, that would be one of the confirmations of the stock moving to next stage.
Stage 2: The Stage To Be In
In Stage 2 the stock breaks out of the horizontal base and starts its upward journey over a period of time.
Be careful , many a times a stock starts moving up but it is till under 30 WMA or it just keeps oscillating above and below 30 WMA . This is not Stage 2. The upmove may not last long and stock may fall further.
Like they say ,‘‘ No magic happens below 30 WMA’‘.
What does a Stage 2 breakout look like?
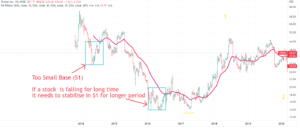
Keep in consideration that any sudden movement above 30 WMA is not an ideal Satge 2 breakout. Ideally a stock should make a long base in Stage 1 – should spenc few weeks ,months in Stage 2. Longer the base, better the chaces of higher returns.
The following image shows similar scenario where false breakouts happened (Twitter stock moved above 30 WMA after spending very less time in S1) and it could not sustain its upward journey.
Trading Range
A good breakout happens after the stock spends a good amount of time in a trading range -between a support and resistance zone . You can draw an upper line for resistance (where stock-price stops and comes bacck in the range ,similarly a line at lower level of prices .These are price levels where stocks bounce back. Price movement between these two lines is called trading-range. Keep a watch when the stock price breaks that trading range and is above 30 WMA.That is the time to take the initial position.
Pullback:
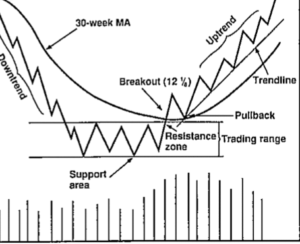
Now one needs to be patient. After breakout ,stock price tend to move downwards and touch the upper line of the trading -range. This is known as pullback.In 80% of the cases, stock prices tend to pull back and retest the break-out levels. That is to shake off the non-believers. Once stock starts moving up again after the pullback and starts trading above 30 WMA, one can add more positions .
Keep a trail that it does not come down below 30 WMA . One can ride it till it does not reach Stage 4.
Some examples :
Reliance traded between a trading range for 8 years .Was oscillating over and below the 30 WMA and was ina trading range but when it broke out of the trading range and started moving up 30 WMA, it became 3 X with in 2 years.
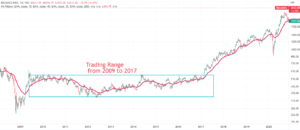
As the base (S1) was for very long period, it was supposed to more higher but a black swan event (Covid -fall) brought it down. But it started its upward journey again once the recovery happened and ended up becoming 5 X in 4 years.
Black Swan Events and S2 stocks
Keep in mind if a stock is in S2, it might go down during sudden balck-swan events ( Covid, War or some toher big unexpected big event ) but they would resume their journey once things settle down.
But the journey stops if overall market enters into a bear market zone that means bad economy, bad performance of the sector and company, less liquidity.And the stock eneters S4 , the stage of decline.
Another example :
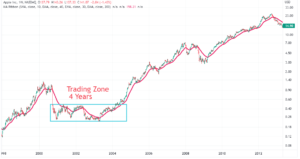
Apple was in a trading zone for4 years and then it went up from US $ .44 to US $ 6 approximately 15 X journey, before it broke 30 WMA in 2008 during global-financial crisis. But as soon as the global crisis went away ,it again came back in S2
Good Stage 2 Breakouts – few key charactersitics
A good quality Satge 2 breakout has certain key charactersitcs.
The more a stock matches the attributes of a high quality Stage 2 breakout the higher the probability of catching a big winner.
-
- Trend Of The Overall Market
- The trend of the overall market needs to be higher for Stage 2 breakouts to succeed well.
- If the trend of the market isnot supportive , it can put pressure on even the best of S2 stocks.
- Sector
- Studying the relative strength of a sector is a key ingredient of finding big winners.
- If a stock belongs to an outperforming sector it has a much higher probability of being a big winner .
- There are very few cases where individual stocks don’t move according the sector. But those are special situations like some merger, acquisition or demerger etc. Otherwise stock tend to move in horde ie. alongwith the other stocks of the sector .Hence sector-watch is important.
- Volume
- The breakout needs to occur on increased volume, ideally 2x average weekly volume for the breakout week, or 2x average volume in the weeks leading up to the breakout followed by an increase in volume during the breakout week.
- If there is poor volume during the breakout the breakout has a much higher probability of failing.
- Volume is critical as it tells that accumulation is happening by the big hands which helps the stock sustain an uptrend.
- Slope Of 30-week Moving Average On The Breakout
- 30-week moving average line should be on rising slope during the breakout. This tells that that the stock has initiated its uptrend and is out of the sideways basing phase (trading-range) .A flat or downward sloping 30 WMA is a bad sign for any successful S2 breakout.
- Resistance
- In Stage Analysis ,you should be interested in gazing at the resistances from the previous 2 years of stock-journey, that means where prices were stopping during last 2 years .
- The more overhead price action above the breakout during the past 2 years the more resistance a stock has. In our studies of past big winning stocks almost all of them were trading with no overhead resistance, so if you can catch a breakout with no overhead resistance that’s the ideal setup.
- Relative Strength
- The stock should be outperforming the index (Nifty or Sectoral Index) on the breakout which means that %ge increase in stock price should be higher than %ge increase in index or sectoral-index.
Stage 3: Consolidation/Topping Stage
The stock starts to trend sideways in Stage 3 and lose momentum to the upside.
- The stock should be outperforming the index (Nifty or Sectoral Index) on the breakout which means that %ge increase in stock price should be higher than %ge increase in index or sectoral-index.
- The 30- week moving average also loses its upward slope and starts moving sideways. The price action in the stock usually occurs much more above and below the flattened 30 week moving average than it did in Stage 2.
- The stock will either breakdown into a Stage 4 decline after this stage, or after a consolidation break back into another Stage 2 advance.
What you should do in this stage:
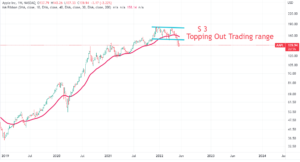
1) Wait for a Stage 4 breakdown to sell the stock, make a trading-range like the one suggested in Stage 2 .Sell the stock when it breaks the trading range at the top and is below 30 WMA or just sell the stock in this stage if the technical action starts to form a significant top.
2) If the stock happens to break back into a Stage 2 advance, buy the stock back or add more shares if they still hold the position.
Example -Apple 2022
- Google 2022
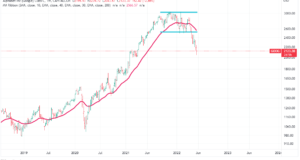
- Sobha
- Trend Of The Overall Market
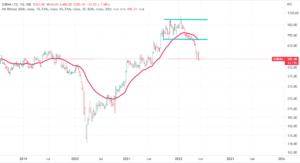
Stage 4: Declining Stage
The stock breaks down below Stage 3 trading range and below the 30-week moving average in Stage 4, and continues to decline mostly below the 30 week moving average.
The 30-week moving average begins a long slope downward.
What you should do in this stage:
1) Sell positions during the transition into this stage, since you don;t know how lot the price can go.
2) Stay out of all stocks in Stage 4 and don;t enter then till they enter Satge 2 even if the happen to be your favorite stocks .
Very -Very Long Term Investors
If someone has a view for 2-3 years , he/she can use 40 week moving average (in place of 30 WMA) for exit , many a times stocks take support at 40 weeks moving average and start their journey again.
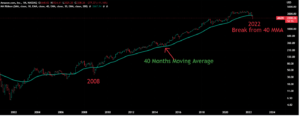
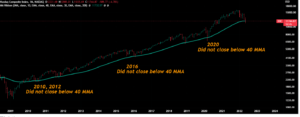
For investors having 5-10 years views, 40 months moving average can be a good tool.Breaking 40 months moving average (excpet in black swan events) is a sign that something is changing structurally.
We got worried about US markets when Nasdaq as well as Amazon broke their 40 MMA.
Have a look at the charts of Amazon as well as Nasdaq comosite (May 2022)
Current Market View
For your information, we feel that have now entered a medium term bear market so time be bit cautious while deploying fresh money. You can read our views on the same by clicking here –Dooms Days -A pessmistic view of the markets.
25 claps




Amazing write-up of stage investing. Reads as a fine adaptation and improvisation of Mike Minervini’s SEPA by applying it to Indian stocks. Request to take through the charts in detail especially on the volume aspects, thanks a ton 👏🏽👏🏽👏🏽
Nicely presented in a simple way.
I am not comfortable with charts and patterns.
Only crunching nos before investing.
Hence I am experiencing problems, especially with selling.
Thank you