Home Blog

C Wave For Bargain Hunters

4
C Wave for Bargain Hunters

 C Wave -Ideal Time for Bargain Hunters

Hope many of our readers enjoyed the recent bear market rally  ( yes we believe that we’re in a bear market and recent rally was just a pull-back , a bounce in B wave )

And now it seems that we’re on the verge of starting a C wave on all global major stock-indices.

The reasons are obvious :

-Increasing inflation

-Falling dollar ,affceting glabal level debt and repayment capabilities

-Fed increasing interest rates , rising bond yields, falling bond prices

-Depleting liquidity

-Ukraine war

Seems to be a perfect situation for the start of a C wave in equity-markets.

Types of Big Falls !

Before we deep dive into more details about imminent C wave  , let’s understand the 2 types of big falls in finanacial markets .

The big falls happen due to two reasons :

1. Macro-factors

2. Black-swan events (sudden, unpredicatable)

The fall due to black swan events is sudden and ferocious- as these are sudden events ,market has not  discounted these factors , it gets a shock and try to make sense out of this suddenness.

In black swan events, big market players first immediately try to come out to comprehend the impact of the black- swan event , after understanding it they discount it & come back to the markets.That’s why recoveries are fast ( Kargill,Demonetozation,Covid etc)

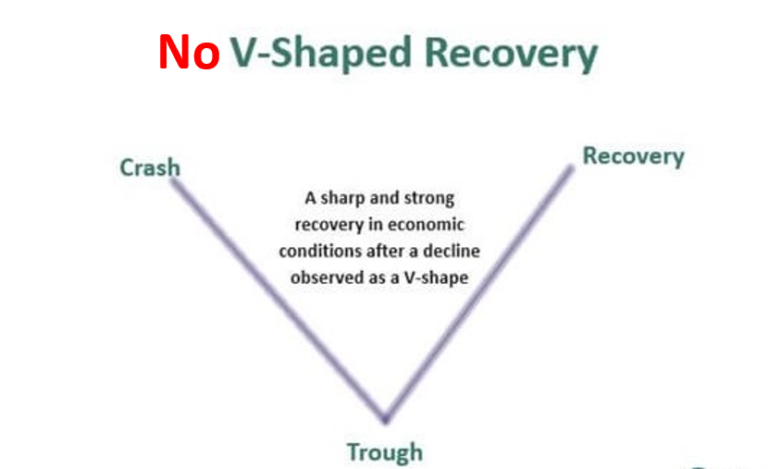
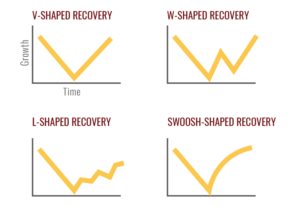
Here the fall is very quick but recovery is also fast (know as V shaped recovery) .

But  it is not the case wrt the fall related to macro factors .

These are  underlying invisible factors , not easy for a common investor to understand as these are not felt by 5 senses . And macro involves lot of interelated events that are not easy to comprehend in advance.

Initial fall related to macro factors is slow and grinding – with lots of ups and downs.Informed investors (hedge funds, pension funds, FIIs,DIIs  ) sense it early & they sell at the beginning.But small and uninformed investors still keep on buying the dip as market keeps them rewarding . Big investors don’t liquidate their positions in a rush. They keep the markets attractive for small and uninformed investors to sell their own stocks at  higher prices.This phase is called distribution phase where big-money distributes their holdings slowly-slowly .Once they have liquidated most of their holdings then they have no interest to keep the prices high and then th prices plunge ferociously.

It is like termite,initial damage is not visible but the tree falls suddenly after a while.

C waves come in both type of falls – it is slow and grinding initially in macros-related fall and catches up the speed in later phase but in black-swan-events related fall , it is sudden and very fast.

What Is C wave ?

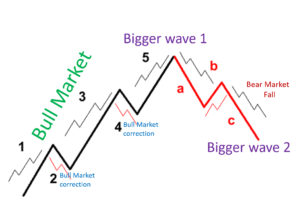
Well there is a theory named Elliot Waves. This theory  in technical analysis used to describe price movements in the financial market. As per this , price of every thing ( whereever there’re masses involved ) moves up in 5 waves (1,2,3,4,5) and then come down in 3 waves (A,B,C). The following picture can give you more clarity.

 Elliott Wave Cycle
Elliott Wave Cycle

In C wave , the prices fall very sharply as well as can go very deep. In theory, wave C should be equal to wave A i.e. the fall in C should be equal A. But in real practice, many times wave C ends early or can become much bigger than wave A.This is difficult to predict in advance.

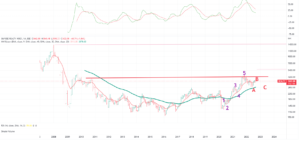
You might like to look at the follwing  Nifty 50 chart of last 30 years and can see how C waves work !
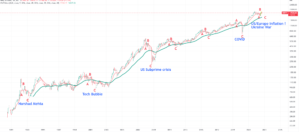
Nifty Historical Chart

Keep in mind, C waves keep coming on all time frames- hourly , daily, monthly ,yearly etc etc.

Bigger the time frame-bigger the impact. Here we’re refering to a C wave on larger time frame i.e. monthly.

In the above picture, one can easily find that C waves were brutal during every major global crisis. Are we going through similar crisis ? Well only time would tell!

Are We Sure That Wave C is coming ?

Well no one can be sure of anything – future is uncertain ! One can just work on probabilities , like we do in very sphere of life knowingly or unknowingly.

Food for Thought

There are two kinds of forecasters: those who don’t know, 
and those who don’t know they don’t know – John Kenneth Galbraith

So we’re tyring to forecast here by clearly knowing that we don’t know. Many of the Elliot practioners belive that , we might be entering the C wave on most of the global indices.

How To Play Wave C ?

Well for long term investors, it is an ideal period for bargain hunting . One needs to wait patiently and let the prices settle down and pick the underpriced businesses at bargain prices.

One can get the prices on one extreme of pendulum . In short ,C wave is an ideal time for long term investors and bargain hunters.

( Hope you know about pendulum theory ? Pendulum theory says that when stocks head downward after a period of overvaluation, they won’t stop at fair value. Instead, they’ll keep dropping until they hit lows that are in some sense as out of whack as previous highs, or close to it. )

And it is a waiting game , just like fishing . Market demands lots of patience to give handsome rewards .Wait can be for weeks and months with lot of tempting-periods known as FOMO in beteween .

Traders look for shorting opportunities in wave C.

What Bargains We’re Looking For ?

Well we beilve that if Indian economy has to do well , old economy stocks should perform well ( as for those to perform we don’t need to look towards West or rest of the global economy where we find lot of trouble points and that may last longer than expectations)

And becuase we  believe in doing technical analysis apart from looking at the fundamentals of business , recent multi-decadal break-outs in several sectors somehow supports our theory on old-economy stocks.

Also as per our experience, once a cycle  of a sector turns , it can last 5-10 years.

But don’t hurry at all. There are no V shape recoveries in these kind of macro-factors related falls.They linger on for weeks and months. Better to watchout from distance . Once the next bull run starts , you will have ample time to enter – buy high ,sell high is better strategy than buying every dip when you don’t know the bottom  – a newbie can follow  Stage Analysis method .

In coming months, in this C wave ,we would be hunting for bragains in following sectors :

Power –a breakout after 13 years
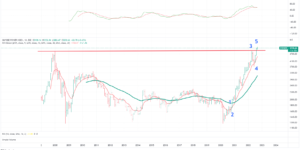
power

Capital Goods – a breakout after 13 years
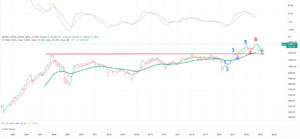
capital goods

Realty – A breakout after 2009

realty sector

In summary : Our assumptions are

a) C wave is about to start ( or it has already started)

b) We might get good bargains once C wave is baout to complete

c) Old economy related stocks gave their first leg of rally in last 2 years ( wave 1) and now they also might give correction (wave 2) alongwith rest of the market .

d) Wait patiently and start buiding positions as per Stage Analysis method.

e) Keep in mind that C waves are also not in straight line, they can have different structures .One of the simplest structure is ABC , that is with in C wave , you fall in A wave , bounce back in B wave and again fall in C wave.

Disclaimer : Above thoughts are just views, may or may not play out.

When To Buy The Dip ?

0
buying the dip 1
buying the dip 1

Should you buy the dip? The phrase “buy the dip” means jumping into the stock market when it is falling, hoping to scoop up some low-priced stocks for longer term profits.

This habit becomes more pronounced among newbie investors especially in a bull-run when one buys certain stocks when prices go down . In a bull -run , prices start their upward journey again afer a small-pause or correction.

But is it always a  good strategy to buy the dip?

Well it might prove profitable in a bull run but it can be highly counter-productive when there is revesal in the bigger trend . Dip starts getting deeper and investors need to hold the stocks for a very long period of time for the stock -prices to recover 9 and in many case the old prices never come)

There are times when investors should start playing the opposite i.e. “selling the rip’, sell-on-rise”  selling into a short-term move higher in stocks?

In short,  in every market there is a time to buy-the-dip ( when the prices correct ) and there’s a time to wait  or sell when prices are rising. There is a time to start the SIP and there is a time to stop your SIP and book your profits.

Understanding the difference between buy-the-dip vs sell-the -rip  timings can help an individual to make more money as well as to keep the hard-earned profits safe.

Buying- the-dip or doing SIP  at wrong time, in wrong phase of the market can lead to big losses wrt money, time and energy. Whereas waiting and sitting out can be very helpful for long-term investor if he/she is able to deploy the funds at the right time.

Let’s try understand  by comprehending the bigger  picture on  when one should be -buying -the-dip (SIP ) , when one should be selling-on rise and  when to wait and sit-out of the markets .

For this ,we need to have a clarity about the larger phases of the markets.

Market Cycles.

There’s a theory named Elliot Waves  . As per this theory , every market moves in cycles and there are waves in-between.Every big upside/dowside wave has 5 waves with -in (fractals)

Once the 5 waves get completed in a trend (up/down), the trend on the other side begins.

bull bear

Similarly there’s another study named Dow Theory. 

The Dow theory is an approach to trading developed by Charles H. Dow.

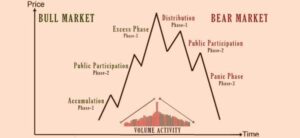
As per this , there are different phases in the market as following:

dow theory


The practitioner of these theories try to find out when 5 waves are complete or to identify the distribution phase.
The study is based on counting the waves as well as looking at volume/price actions to understand accumulation/distribution phases. This analysis is combined with macro-environment and economic cycles .

Many a times , economic down-cycle and bear market overlaps and many a times there is time -lag as market works as a robust future -discounting mechanism.

Because when one sided 5 waves move is over or accumulation phase is over, the bigger bear market (correction in the prices ) starts that can last for months and years.

Till the time, you are in one side upward going 5 waves or in accumulation phases , buy-the -dip makes sense. But when the 5 waves get over or accumulation phase ends, it is the time either to sell or wait till the time next upmove cycle starts.

When to start buying ?

If you’re in a bull market ie. when market is trnding up, one can buy the dip at every bull market correction. One can learn one of the three methods – Eelliot Waves, Dow Theory or Stage Based Investing.

But in a bear market ,one needs to wait and sit out. Wait for the nest uptrend to begin and then jump-in at the right time.

That means that one needs to be astute enough to understand whether the market is doing correcion where overall trend is still bullish ( 5 waves uptrend or accumulation phase ) or it is getting into distribution phase. If the trend is still bullish, buying-the-dip makes sense but if the market has entered in long bear phase, it is wise to wait.

In bear marekts,one can keep an eye on macro , as soon as some green shoots of recovery are seen in the economy. At the same time, one can learn Elliot or Dow theory to understand whether the  fall has stopped and bottom has been made.

Apart from that, there ais another method, popularised by Stan Wienstein. It is known as Stages-Based-Investing model . And this model helps in  the identifying  different phases of the market ( or a stock) in a very manner.

stage investing

To learn more about this method, you can click here.

Buy High , Sell Higher 

Stage Investing, Dow theory as well as Elliot wave theory are quite in contrast of popular- market myth named ‘buy-low-sell-high’. Rather veteran investors wait for the prices to start moving up and when trend becomes favorable . This strategy is also known as ‘buy-high,sell-high’.

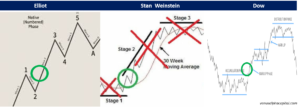
Look at the following picture carefully. This gives a bird’s eyeview of buying -timing as per all three theories mentioned above.

buy high sell high


The green circles indicate the buying timing . None of these three experienced  and successful investors suggest to buy at the lowest price ( rarely anyone can catch the bottom price) .

As per Elliot, one should buy when wave 3 starts, as per Stan , one should buy when the price closes above 30 weeks moving average ( there are bit more nuances to it) and Mr. Dow suggests to buy when the accumulation phase is over ( when market and  stock-price starts making higher -highs and higher-lows).

There are sevral advantages of understanding any of these theories e.g. one would buy only when the market and stock prices are going up , one would enter the market when bg fund -houses are entering the market and they have made the bottom , and this would also be the time when all desperate sellers have given up on the market by getting frustrated by lower or no price movement in the stock.

If you play the strategy right, you can take advantage of what’s called reversion to the mean. The idea here is that by buying stocks after they’ve fallen, you can ride them to higher long-term gains as they re-accelerate to their long-run average gains, that is, revert to their mean return.


Brain Switch -Bull To Bear & Vice Versa

0
bull bear
bull bear

Switch in Our Brain !

Sadly we don’t have a switch in our brains – for us to turn it from optimistic to pessimistic, and from bullish to bearish !

And equally sad part is that we’re not trained in behavioural-finance that is as critical as any other tool for successful investing journey.

(Balancing your pessimism/optimism in bull/bear markets is a great skill  but it is easier said than done .Problem with masses is that they tend to be  on extreme ends at one point of time- either greedy or fearful .That’s why markets move like a pendulum -from euphoria to pessimism and then back to euphoria.)

Recency bias  too plays a significant role . While coming out of a bull -market all  the great stories of recent past play a role on our minds – our eyes get trained to see the breakout stocks & we tend to start believing that corrections last only for short periods and they are good opportunities to buy on the dip .

We tend to forget that not all corrections are short-term corrections , some corrections happen to be deep and for very long term .Some corrections happen to be beginning of long bear markets and darkness becomes deeper as we move along.

Switching the mindset to the other side becomes harder as we tend to  become complacent when  the path we’re following  looks familiar , the trend becomes a friend and the events around us tend to be aligned with our exepectations.

We humans are  very good at forecasting the future, except for the surprises, which tend to be all that matter.

Now it seems that we’re entering a bear market zone – and it is difficult to gues how long it would last !

Key point at this transistion phase ( from bullish to bearish) is whether we’re ready for our brain to transit to this low or zero return zone .

The point is to be prepared. The biggest risk is always what no one sees coming.

If you don’t see something coming you’re not prepared for it. And when you’re not prepared for it its damage is amplified when it hits you.

At this juncture ,preparing our minds to  the probability of a long low -returns period might save us from certain hidden risks,can help us calibrating our future expectations.

This is also a good time to remember what Howard Mark wrote in his 2016 memo ( On the Couch ).

He wrote, “in the real world, things generally fluctuate between ‘pretty good’ and ‘not so hot.’  But in the world of investing, perception often swings from ‘flawless’ to ‘hopeless.’”

Let’s help you by giving some insights about the bear markets ( situation turning from flawless to hopeless) ,that might help your brain in the transit phase , in case it becomes a serious bear market.

Bear  Markets -Key Charcteristics :

i) Counter -Trend Bounces/Rallies

Bear markets don’t imply that the prices of your stocks won’t rally upward in between.

The deepest bear markets have tended to produce the largest and longest bear market rallies.And sadly there is no sure way to identify a bear market rally  in advance as such until it unwinds.

And most of the bear market rallies (counter trend bounces) happen to be fast and ferocious . Markets want you to belive that we’re back in upward journey.

And that’s where your money gets sucked .You recncey bias and success of buying-on-very-dip in bull markets tempts you to deploy fresh cash. And then you get the hit.

These counter-trend bounces in an ongoing bear market are  treacherous for investors who mistakenly tend to think that the downturn is going to end. As the primary bearish trend reasserts itself, the disappointment of those who bought during a bear market rally leads to drive the prices to new lows.


BEAR Market

“Lack of FOMO” happens be one of the most important investing skills (behavioural finance) – although during every phase of the market but it is much more critical during counter-trend rallies.

ii) Slow Bleeding

Bear markets fall are quite unlike as compared to black-swan events crashes .Black-swan events related falls are  sudden  e.g. at the time of Covid, demonetaisation as well as when whenever there’s a sudden war. Recovery from these sudden falls happen to be quicker in most of the cases .

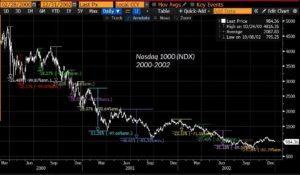
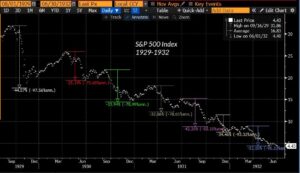
But bear markets are result of some cyclical changes in overall economic -factors. They are slow and grinding .And the falls comes in waves . When you feel that markets have gone down enough, they tend to fall more.

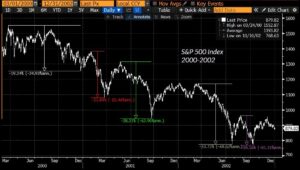
The following charts show the waves of falls in the past bear markets of USA .

bear3

bear 2
bear 2

iii) Re-set Benchmarks for Valuing a Business

One needs to set new benchmarks of PE ratios, market cap to revenue mutiples need to recalibrated, EV to EBIDTA needs to be adjusted new standards..

Old standards of valuing a business in a bull-market are not applicable to the bear-markets.

iv) Phases of a Bear Market 

As per Investopedia , there are 4 phases of a bear market

  1. The 1st phase is characterized by high prices and high investor sentiment. Towards the end of this phase, investors begin to drop out of the markets and take in profits.
  2. In 2nd phase, stock prices begin to fall sharply, trading activity and corporate profits begin to drop, and economic indicators, that may have once been positive, start to become below average. Some investors begin to panic as sentiment starts to fall. This is referred to as capitulation.
  3. The 3rd phase shows speculators start to enter the market, consequently raising some prices and trading volume.
  4. In the 4th and last phase, stock prices continue to drop, but slowly. As low prices and good news starts to attract investors again, bear markets start to lead to bull markets.

v) Quick Money on Short side

You make quicker money in bear markets if you are on short side – because pessimism is contagious ( like COVId ) – everyone gets it at the same time  and market falls faster.

1129083

But for crowd to become optimistic,it takes time , it is gradual , people want proof ( that’s why retailers (masses) buy at the peak of the markets when every proof of upside is already there ). So upward movement is rather slow as cpmpared to dowside -movements.


Don’t Run Away 

                            Replace Your Emotions With A  System

Market is more of a brain and liquidity game – earlier (in the cycle) you understand it , better you would be .

Don’t go buy media that talks about SIP in falling markets etc etc , that is for average people .Don’t buy on the basis of your gut -feeling or something looks cheap.

Have  a time-tested system or method for entry and exit , a system that suits your temperament, your risk-taking ability & appetite as well as your stage of life. For example, we follow Stage Analysis technique to enter and exit the stocks we love.

You can click here if you also want a simple rules-based method.

Rules and discipline helps us to overcome our emotional -biases as well as helps us to ignore  the noise around us.

Summary :

Let’s try to imagine that we have a switch in our brains. But that switch can only work by going with the trend – switching the sides is the key – remember you are not on a ego trip in this market but you’re on a money – making trip – change your views when the underlying facts change – don’t be rigid , be like water – formless , shapeless ,egoless and  long-term opinionless – go with the wind my friend .

Entry Exit Strategy in Stocks- Stage Analysis

2
dont buy the dip 696x431 1

If you’re buying the dip in this fall , then you might be doing a mistake.

In this article ,we  discuss about the  Stage Analysis technique and how it can help medium to long term investors for timing of their entry and exit price points in their equity-investment journey.

This strategy is in contrast with very common investment approach that advocates ‘Buy-low ,Sell high’. This strategy favors ‘Buy -high ,Sell-high’ .

Basic Principles :

This strategy is based on 2 principles :

A) It is difficult to gauge the extent of the fall/rise in any stock-price .No-one can know in advance the extent of fall or rise in the price .Market can be irrational on both extremes.

B) Other key consideration is timing. The stock-price of a company can linger in certain price-range for weeks ,months or years. This results in loss of your potential gain from other alternatives when one alternative is chosen and that does not giving any returns (opportunity cost ).

entry exit equity

One of the objectives of this analysis is to find and  ride on a certain stock when instituational investors or HNIs are entering a stock . This is becaue, in most of the cases a stock can not go up unlesss big hands  show intrest in it and buy it in good volumes.

On the other hand, it also helps in identifying the stocks where big hands are exiting and one can try to time his exit near to those price-points. This is because when big hands are exiting and there is no one to support the price of a stock, then the price can fall to any levels.

Key Components of Stage Analysis 

The quicker you want something,the easier you are to manipulate.

To succeed in markets, one needs to patient and this apporach helps  you to be patient and to overcome short-term temptations .

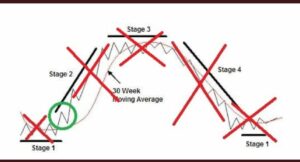
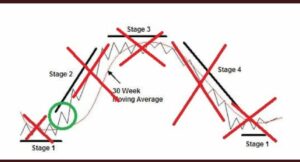
Stage Analysis consists of 4 stages – Satge 1,2,3,4 . The basic premise is to buy a stock when it is starting its stage 2 and exit when it enters in stage 4. You would know more about these stages as you read forward.

Basic Requirements :

To work as per this strategy , you need to familiarize yourself with the charts of the stocks-prices that you find interesting.

These charts are easily and freely available .Either you can use your broker’s website or you can use TradingView.com or Investing.com .

Once you know , how to open and see the charts , here are some additional requirements for stage analysis :

Weekly  Chart – Stage Analysis requires you to work on weekly charts. since the system is designed to be for medium to longer term investments, from weeks to months to years at a time.  Stage Analysis is not a system for day trading.

30-Week Moving Average WMA) – The price action on the weekly chart is compared in relation to the 30-week moving average in order to identify the specific stage of the stock.

One needs to check the weekly closing price in comparison to 30 week moving average (WMA) price. Whether price is higher /lower or sideways in relation to 30 WMA, will tell you the stage of the stock.

Volume – A key component of this stratgey is to keep an eye on volume.The transition from one stage to another  requires a big increase in volume .

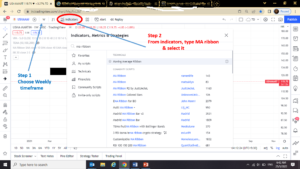
The following picture is to help novices who are first time oening the chart.

Picture1 1

1. Choose weekly chart

2. From indicators , choose MA Ribbon and once you’ve indicator on your chart, only keep one moving average – 30 , close the rest.

3. Also find volumes from indicators and select.

Stages in the Life of a Stock:

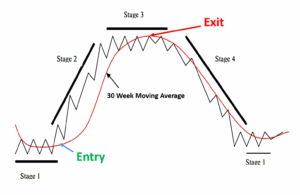
Once you have the basic knowledge of charts and moving averages , it is very easy to identify the stage of a stock. As mentioned before , a stock can be in either of 4 stages based on 30 WMA.

Stage Analysis uses 4 distinct stages that a particular stock can be in.  The stage, and transitions between stages, have specific guidelines for whether an investor should buy, sell, or hold that particular stock.

The following picture can help you to detemine the stage.

stages in stocks 1
stages in stocks 1

Stage 1: Basing Stage

A base is simply a period where the stock moves mostly sideways instead of trending up or down. A base can be formed after a rise or  decline in the stock price.

in Stage 1, the stock forms a long horizontal base .  The longer the horizontal base the better.   A long base  establishes a more significant support level, as the ownership of the stock will transfer from weak hands to strong hands because weak hands might have exited the stock either due to price -correction or by getting frustrated due to no price movement.

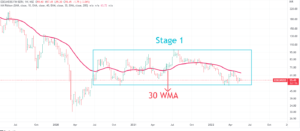
While forming a Stage 1 base, price action  usually oscillates above and below the 30-week moving average .

Satge 1 Stock

The above example is of Edelwiess Finacial Services.

The stock price is in Satge 1 and is hovering between INR 50 and INR 100  for last two years and has not participated in post-Covid fall bull run. The price just keeps moving up and down of 30 WMA and is not showing any siginificant strength.

What you should do in this stage:

1) Just in Watchlist : No action required in this stage, just keep a close watch and note down the price when they’re likely to breakout into a Stage 2 advance (refer to Stage 2).

Do not  take a position in this stock in this stage . The  stock can continue to be in the Stage 1  for months to years  (like in the above example of Edelweiss).  Your capital will be tied up as stock  will  go nowhere and would keep resting in this base for a long period of time.

2)  Sector Watch :Stocks tend to move in a herd . Take a look at the sector the stock is in and see if the entire sector is also in the same stage.  This will help in validating the stage  at the time of  breakout into Stage 2 . If the entire sector moves with your stock, that would be one of the confirmations  of  the stock moving to next stage.

Stage 2: The Stage To Be In

In Stage 2 the stock breaks out of the horizontal base and starts its upward journey over a period of time.

Be careful , many a times a stock starts moving up but it is till under 30 WMA  or it just keeps oscillating above and below 30 WMA . This is not Stage 2. The upmove may not last long and stock may fall further.

Like they say ,‘ No magic happens below 30 WMA’.

What does a Stage 2 breakout look like?

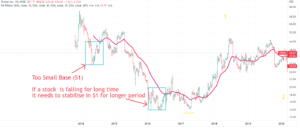
Keep in consideration that any sudden movement above 30 WMA is not an ideal Satge 2 breakout. Ideally a stock should make a long base in Stage 1 – should spenc few weeks ,months in Stage 2. Longer the base, better the chaces of higher returns.

The following image shows similar scenario where false breakouts happened (Twitter stock moved above 30 WMA after spending very less time in S1) and it could not sustain its upward journey.

TWTR 2022 05 25 22 04 05

Trading Range

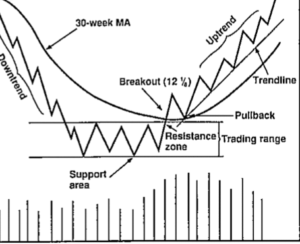
A good breakout happens after the stock spends a good amount of time in a trading range -between a support and resistance zone . You can draw an upper line for resistance (where stock-price stops and comes bacck in the range ,similarly a line at lower level of prices .These are price levels where stocks bounce back. Price movement between these two lines is called trading-range. Keep a watch when the stock price breaks that trading range and is above 30 WMA.That is the time to take the initial position.

Pullback:

Picture1 3


Now one needs to be patient. After breakout ,stock price tend to move downwards and touch the upper line of the trading -range. This is known as pullback.In 80% of the cases, stock prices tend to pull back and retest the break-out levels. That is to shake off the non-believers. Once stock starts moving up again after the pullback and starts trading above 30 WMA, one can add more positions .

Keep a trail that it does not come down below 30 WMA . One can ride it till it does not reach Stage 4.

Some examples :

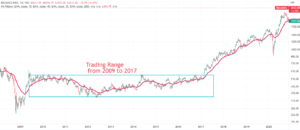
Reliance traded between a trading range for 8 years .Was oscillating over and below the 30 WMA  and was ina trading range but when it broke out of the trading range and started moving up 30 WMA, it became 3 X with in 2 years.

RELIANCE 2022 05 25 22 27 17

As the base (S1) was for very long period, it was supposed to more higher but a black swan event (Covid -fall) brought it down. But it started its upward journey again once the recovery happened and ended up becoming 5 X in 4 years.

Black Swan Events and S2 stocks

Keep in mind if a stock is in S2, it might go down during sudden balck-swan events ( Covid, War or some toher big unexpected big event ) but they would resume their journey once things settle down.

But the journey stops if overall market enters into a bear market zone that means bad economy, bad performance of the sector and company, less liquidity.And the stock eneters S4 , the stage of decline.

Another example :

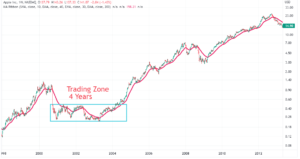
Apple was in a trading zone for4 years and then it went up from US $ .44 to US $ 6 approximately 15 X journey, before it broke 30 WMA in 2008 during global-financial crisis. But as soon as the global crisis went away ,it again came back in S2

AAPL 2022 05 25 22 40 13

Good Stage 2 Breakouts – few key charactersitics 

A good quality Satge 2 breakout has certain key charactersitcs.

The more a stock matches the attributes of a high quality Stage 2 breakout the higher the probability of catching a big winner.

    • Trend Of The Overall Market
      • The trend of the overall market needs to be higher for Stage 2 breakouts to succeed well.
      • If the trend of the market isnot supportive , it can put pressure on even the best of S2  stocks.
    • Sector
      • Studying the relative strength of a sector is a key ingredient of finding big winners.
      • If a stock belongs to an outperforming sector it has a much higher probability of being a big winner .
      •   There are very few  cases where individual stocks don’t move according the sector. But those are special situations like some merger, acquisition or demerger etc. Otherwise stock tend to move in horde ie. alongwith the other stocks of the sector .Hence sector-watch is important.
    • Volume
      • The breakout needs to occur on increased volume, ideally 2x average weekly volume for the breakout week, or 2x average volume in the weeks leading up to the breakout followed by an increase in volume during the breakout week.
      • If there is poor volume during the breakout the breakout has a much higher probability of failing.
      • Volume is critical as it tells that accumulation is happening by the big hands which helps the stock sustain an uptrend.
    • Slope Of 30-week Moving Average On The Breakout
      •  30-week moving average line should be on rising slope  during the breakout.  This tells that that the stock has initiated its uptrend and is out of the sideways basing phase (trading-range) .A flat or downward sloping 30 WMA is a bad sign for any successful S2 breakout.
    • Resistance
      • In Stage Analysis ,you should be  interested in gazing at the resistances from the previous 2 years of stock-journey, that means where  prices were stopping during last 2 years  .
      • The more overhead price action above the breakout during the past 2 years the more resistance a stock has.  In our studies of past big winning stocks almost all of them were trading with no overhead resistance, so if you can catch a breakout with no overhead resistance that’s the ideal setup.
    • Relative Strength
      • The stock should be outperforming the index (Nifty or Sectoral Index) on the breakout which means that %ge increase in stock price should be higher than %ge increase in index or sectoral-index.

        Stage 3:  Consolidation/Topping Stage

        The stock starts to trend sideways in Stage 3 and lose momentum to the upside.

    • The 30- week moving average also loses its upward slope and starts moving sideways.  The price action in the stock usually occurs much more above and below the flattened 30 week moving average than it did in Stage 2.
    • The stock will either breakdown into a Stage 4 decline after this stage, or after a consolidation break back into another Stage 2 advance.

      What you should do in this stage:

      1)  Wait for a Stage 4 breakdown to sell the stock, make a trading-range like the one suggested in Stage 2 .Sell the stock when it breaks the trading range at the top and is below 30 WMA or just sell the stock in this stage if the technical action starts to form a significant top.


      2)  If the stock happens to break back into a Stage 2 advance, buy the stock back or add more shares if they still hold the position.

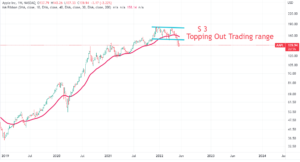
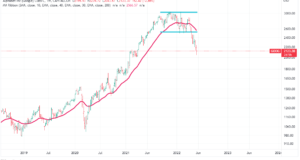
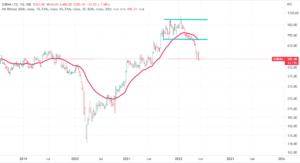
      Example -Apple 2022AAPL 2022 05 25 23 06 28


    • Google 2022GOOG 2022 05 25 23 08 25
    • Sobha

SOBHA 2022 05 25 23 10 33

Stage 4:  Declining Stage

The stock breaks down below Stage 3 trading range and below the 30-week moving average in Stage 4, and continues to decline mostly below the 30 week moving average.

The 30-week moving average begins a long slope downward.

What you should do in this stage:

1)  Sell positions during the transition into this stage, since you don;t know how lot the price can go.

2)  Stay out of all stocks in Stage 4 and don;t enter then till they enter Satge 2 even if the happen to be your favorite stocks .

Very -Very Long Term Investors

If someone has a view for 2-3 years , he/she can use 40 week moving average (in place of 30 WMA) for exit , many a times stocks take support at 40 weeks moving average and start their journey again.

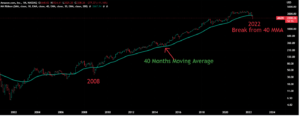
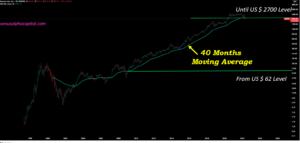
For investors having  5-10 years views, 40 months moving average can be a good tool.Breaking 40 months moving average (excpet in black swan events) is a sign that something is changing structurally.

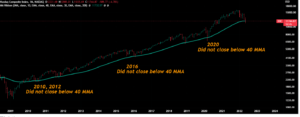
We got worried about US markets when Nasdaq as well as Amazon broke their 40 MMA.

Have a look at the charts of Amazon as well as Nasdaq comosite (May 2022)

AMZN 2022 05 27 03 18 35

IXIC 2022 05 27 03 20 42


Current Market View

For your information, we feel that have now entered a  medium term bear market so time  be bit cautious while deploying fresh money. You can read our views on the same by clicking here –Dooms Days -A pessmistic view of the markets.

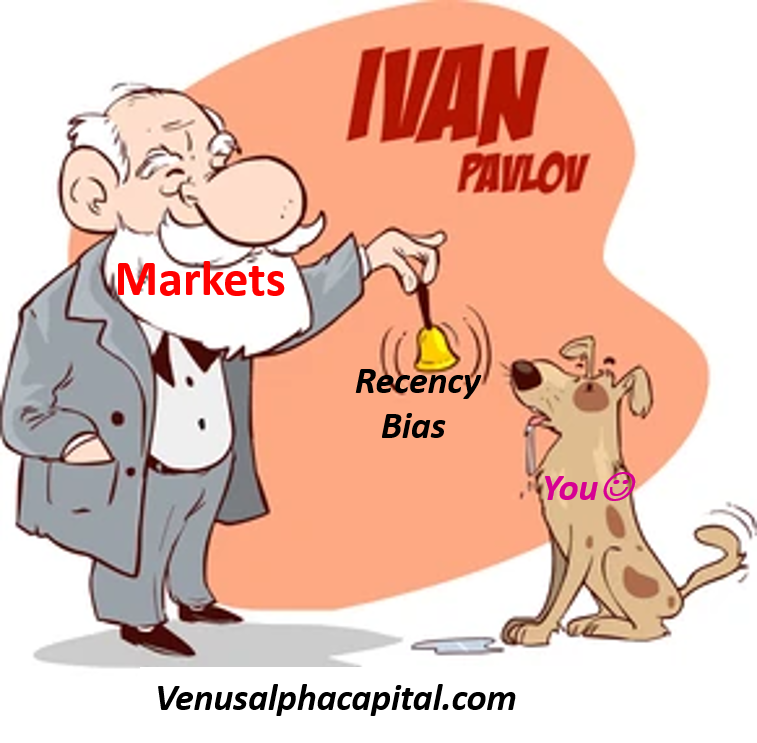
Pavlov, Recency Bias & Investors Behaviour

0
venusalpha
venusalpha

Triangular relationships – Pavlov, Recency Bias & Investors Behaviour

Who is Pavlov and what he has to do with yours or mine behavior in the markets?

Well, let’s first know about Pavlov.

Ivan Pavlov was a Soviet  physiologist known primarily for his work in classical conditioning.  won the Nobel Prize for Physiology  in 1904,[ becoming the first Russian Nobel laureate.

Pavlov is known for his dog experiments. This played a critical role in the discovery of one of  the most important concepts in psychology: Classical conditioning.

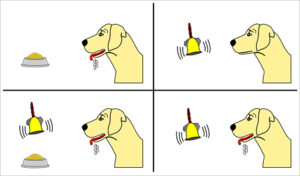
In his digestive research, Pavlov and his assistants would introduce a variety of edible and non-edible items and measure the saliva production in dogs that these items produced.

Before serving the food , they always rang the bell and research-assitants in white coats would go and serve the food.

Salivation, he noted, is a reflexive process. It occurs automatically in response to a specific stimulus and is not under conscious control.

However, Pavlov noted that the dogs would often begin salivating in the absence of food and smell.

The dogs would start salivating as soon as they heard the sound of the bell or the research assistants went to their rooms  – with or without food.

bell dog
bell dog

He quickly realized that this salivary response was not due to an automatic, physiological process.


Based on his observations, Pavlov suggested that the salivation was a learned response.

Pavlov’s dog subjects were responding to the sight of the research assistants’ white lab coats, which the animals had come to associate with the presentation of food.

Unlike the salivary response to the presentation of food, which is an unconditioned reflex, salivating to the expectation of food is a conditioned reflex.


Relationship with humans in Markets:

We can see similar effect in humans during bull and bear markets.

Trend & macro-factors is food in this case and green and red candles are like research –assistants in white coats.

People react on rise and dips based on their recent past experience- Not a logical response to the markets but a learned response based on their recent experience with certain cues and stimulai.

If someone has seen a prolonged bull market, a rise after every dip, they get conditioned to buy on every green candle (research assistants in white coats) ignoring the macro factors and don’t try to understand whether there is a real cause or a real trend behind it (the food).

Similar behaviour can be seen when people undergo a prolonged bear market- they get conditioned to ‘Sell-On-Every –Rise’


In US (mother of all markets) , investors have been buying the dip hoping the Fed will soon capitulate.This is what they learn in last many years of bull-market .

Behavior has been one of the most dangerous aspects of this bubble. For over a decade investors have been conditioned to buy the dip. This is 100% Pavlovian behavior. The regime is changing. And it is changing at warp speed.

What Is the Recency Bias?

In behavioral economics, the recency bias  is the tendency for people to act on the basis of recent information or events without considering the objective probabilities of those events over the long run.

There are numerous implications for recency bias for investors.

A study by Karlsson, Loewenstein, and Ariely (2008) showed that people are more likely to purchase insurance to protect themselves after a natural disaster they have just experienced than they are to purchase insurance on this type of disaster before it happens.

Apex Experience 10.3 Aftershocks3 1024x678 1Decrease in air-passengers traffic  after the 9/11 event is another example of regency bias .
 

People got scared of flying as civil airplanes were used by terrorists to blow-up the building.


Recency- bias  can play havoc on one’s decision making process.

When we make decisions we tend to be swayed by what we remember. What we remember is influenced by many things including beliefs, expectations, emotions, and feelings as well as things like frequency of exposure

This tendency is irrational, as it obscures the true or objective probabilities of events occurring, leading people to make poor decisions.

This bias matters a lot for the financial markets, as memory of recent market -behaviours or events can lead investors to irrationally believe that a similar event is more likely to occur again than its objective probability.

As a result, investors may make decisions to buy into bubbles or  sell into bear markets,  since  recent crashes and bubbles can be salient in the minds of individuals as they are occurring.

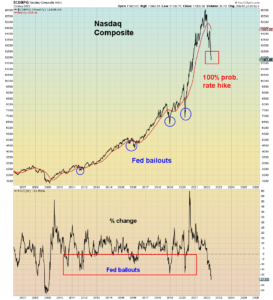
For example, recent breed of invesors believe that Fed would  bailout the markets like it has been doing for last 14 years.

They don’t understand that the bailout cycle is ending due to higher inflation.

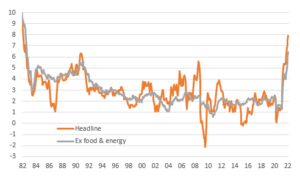
Now situation seems to be very different. Inflation is all time high in USA and FED can’t print the money to support the markets rather it has reduce the liquidity by raising the interest rates.

Understand the following two charts – what were the inflation levels when Fed was bailing out and where is inflation today.


nasdaq fed

us inflation

Understand it asap , come-out of the recency bias ,lest  you’re not left holding the bag.

Don’t fall into the trap of Pavlovian behaviour due to your recency bias.

If you wanna read about our current market views, you can click here.

V Shaped Recovery This Time -Nifty 50 ?

1
v shape recovery
v shape recovery

Why There Won’t Be A V- Shaped Recovery This Time

Stock indices & economies can take different times to recover depending upon the cause of the falls. Hence we need to be bit cautious with respect to our expectations of recovery after every fall.

RecoveryScenarios
RecoveryScenarios

Indices recovered quickly known as a V-shape-recovery after the falls of COVID, Demonetization and Kargill wars  – but can we expect the same this time .

You all would agree that those were black swan events – not discounted by the market in advance – very sudden events .So market recovered very fast as soon as it realized the extent of damage by those events .


But this time – the fall is not out of sudden events – every future news is being discounted now – fall has been slow ( Oct onwards ) – so recovery would also be slow .
We can see a clear distribution pattern from October itself as well as FIIs were selling for last full year .
(In hindsight, that was a clear sign for this ongoing fall as currencies were falling all around the globe but India and few other countries were holding . But FIIs understood that and they cound see that we can no longer save our currency in wake of going against the global trend. They sold Indian and other emerging markets equities even before the real currency-depreciation started)

In a real bear market, there is no capitualation (sudden fall). The fall comes in waves with few recoveries (counter trend bounces ) in between . Bear markets are unlike the corrections that happen in bull markets where markets start moving up after going down a bit.

Here are few examples of bear markes falls from US markets in different periods.

bear 2

bear3

bear1


Bear -markets generally happen to be of 12-18 months duration in India – 6 months already gone – let’s hope we recover in 1st half of next year ( unless US crashes very badly ) And yes, let’s also keep a watch on our currency, more it falls ,more bad it would be for equities.

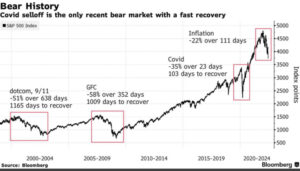
Here’s the historical presepective ( last 25 years ) from one of the world’s mature indexes.

Bear Markets History

Recoveries are slow if equity prices go down slowly in a grinding way. That is the result of structural shift in underlying global-macro factors i.e. economy, liquidity , bubbles in certain pockets etc.

These all views are just opinions – forecasting is not so easy.

DoomsDay Scenarios -Nifty

2
Picture2
Picture2
Well today, we looked at the monthly charts of Nifty 50 – to get a long term picture.
The big picture looks scary .
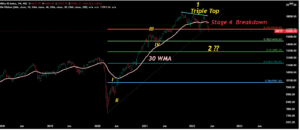
NIFTY 2022 05 14 14 03 25
Monthly Chart Nifty50
As per  the Elliot theory, we have completed Wave 1 (after Triple Top) and now we are in Wave 2.
NIFTY 2022 05 15 06 31 51
Weekly Chart -Nifty 50
Wave 2 happens to be deep (unless we’re starting a new bull run but that is not the case here)….we have already done 23% (1st Fib level) and are now heading to 38% ,near 14473.

download 1

And  near to 38%, level 14417 also happens to be previous ivth wave low, many of the corrections stop at this level.
Also as per stage analysis ,we are in Stage 4 .
Can the correction extend to 50% (between 38% and 50 % ,we might have support near 40 months average at 14070 ) or 62% ?
Critical Levels:
So 38 %  level (14473) , previous ivth wave low of 14417 and 40 months average of 14070 are the crucial levels to watch for. (betweeen 14000 to 14417)
If these levels break, then correction can go more deep .
RSI as well as MACD cycles are yet to complete their cycles !
What if montly MACD  as well as monthly RSI don’t complete their full cycle at 38% or 50%  fib-levels ….in that case ,we are clealrly headed towards very dark days.

Historical PE

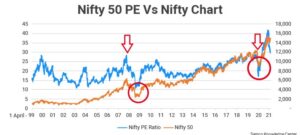
Other aspect we looked at historical NIFTY PE chart.

354 Nifty 50 PE Vs Nifty Chart

In the past, during the severe falls, Nifty has taken support in between PE of 10-15.
If we take 15, the fall should be contained near 12000, but what if Nifty happens to take support at PE of 10, then only God can save us.

FII Support -Possible ?

Can FII support  the market in coming months?
Well, does not look like.
Every country’s currency was depreciating whereas  the same for many countries were holding (including Indian currency) But FIIs were expecting that we can’t stand against this global tide so they were selling beforehand (smart move)
USDINR 2022 05 14 14 32 20
And now INR has broken out – in a beautiful Stage 2 breakout ( as per this model’s projection , it is headed towards anywhere between 85-95).
So FII would wait  for this  currency move to play out completely before bringing the fresh  money is – two obviuos benefits for them
a) They get more rupees for less dollar so their amount goes up by just sitting oversead and waiting
b) As currency depreciates, market tumbles and they get everything cheaper.

Stage Analysis  – DOW, NASDAQ ,NIFTY 50

Stage Analysis is a technique that helps an individual investor to enter and exit his/hers long term holdings.

It is based on the moving average of 30 Weeks.

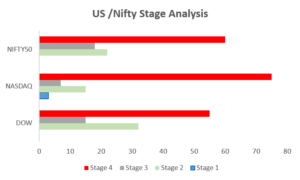
The following picture gives summary of Stage Analysis Method.

stage analysis


As per this analysis , the situation of NASDAQ , DOW and Nifty 50 does not look good. Maximum % of stocks are in Stage 4 (declining phase) . For example ,Nifty 50 has more than 70% stocks in Stage 4.

In all 3 Indexes,one can see that maximum  % of stocks are in Stage 4- a clear sign of a bear market.

Picture1

Macro View -US -Mother of All Markets.

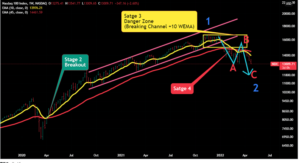
Nasdaq – In Satge 4 . Breaking 40 months moving average after 13 years.

From EW prespective it is in Wave 2. Expect a bounce in coming weeks and then a deeper plunge.

373b92fa8c11818fc5d6b7ef156f2142c15cb837 2 690x374
Nasdaq Weekly

Amazon -similar story

Amazon
Amazon

US Inflation -The Joker in the Pack

Us Inflation is moving higher – highest in the decades.

us inflation
us inflation

US Fed is trying hard to control inflation by raising interest rates – thus sucking liquidity from all capital markets. The risk is recession in US but it seems Fed has accepted that reality – now fight is between mild-recession or severe recession.

Also US FED wants to saves its Bond market in lieu of its issues with Russia and China – and wants people to buy its bonds ( by creating fear around equity). And it seems to be succeding.

As of now it seems that FED is not reversing its stated policy.

Till the time it does not reverse, very less hope for global equity markets- the butterfly effect

You can read Fed Chair Powell interview by clicking here. https://www.marketplace.org/2022/05/12/fed-chair-jerome-powell-controlling-inflation-will-include-some-pain/

Hangover Effect of Heady Cocktail (Nasdaq+Fed+Inflation)

In the past whenever US markets fell, US FED came to help as some of the public is invested in stocks so it wanted to save them.

But look at the inflation chart and the following chart …in the past when FED came to help by decreasing interest rates by doing QE  ,in those years inflation was not an issue.

nasdaq fed
nasdaq fed

But this time -दोस्त  (FED) खुद ही मुश्किल में है. Political bosses want Fed to focus on inflation-control as otherwise they may loose votes.

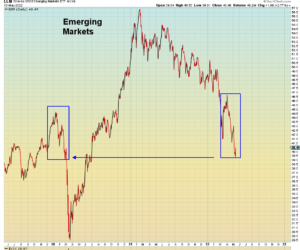
Now with these rates hikes by FED, US inflation is yet to come under control but  all emerging markets are falling .

EM


Because :

a) Currencies of EMs are depreciating, FIIs fear that they would fall more due dollar strength so they are selling out in all emerging markets.

b) Various foriegn nations and companies have dollar denominated debt, with falling currencies their debt level as well as interest payouts are going up mthus affecting the whole valuations models

c) To fight currency depreciationtion as well as to fight infla, Central Banks (including ours, RBI) of almost all the countries are increasing interest rates. Increased interest rates means lower demand and higher interest cost for the companies – so impact on revenue as well as earnings.

The vicious cycle is on.

Summary – it is a bit depressing picture. Hopefully we would do better than this and there won’t be any doomsdays.

If the worst comes, how It would play out?

No market moves  in a straight line .

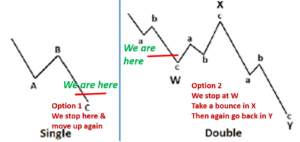
Here are the 2 of the several likely paths to the downside.

Picture2 1

Path 1 – We stop at 15671 -March lows

Path 2– We stop near 14400-450 levels  (W) , bounce back in X and then again plunge upto level Y

Path 3 – And if market wants move  towards  11900 & beyond, then it can bounce back in X again  (after Y ) and go upto Z as a final move.

Disclaimer: This is one sided view of the markets. Market may behave very differently than discussed above. Use your own discretion to make your investment decisions. Take every opinioon with pinch of salt.

Bulls, Bears And Humans

0
bulls bears humans
bulls bears humans

The Bear Market ,The Bull Markets and Poorly Evolved Human

In the fight of bulls and bears, human’s biases play out in the open.

Recency -bias, Anchor-bias, evolutionary-optimism everything gets mixed up.

Unsustainable things can last years or decades longer than people think – stocks are never traded at fair value – they go to extremes on either side .
because about once a decade people forget that bubbles form and burst about once a decade.

In a bear market, expectations move slower than reality on the ground, so a lot of frustration comes from clinging to the trends of past eras.

In bull markets, we tend to forget that we are extrapolating machines in a world where nothing too good or too bad lasts indefinitely.

Optimism and pessimism always overshoot because the only way to know the boundaries of either is to go a little bit past them.

In bull markets, your expectations grow faster than your money but still you’re never happy no matter how much you accumulate so you take more risks -you risk what you need in order to gain something you merely want. And you don’t want to listen to genuine voices because past performance increases confidence ( more than ability).

Benchmarks change in every decade.

But for an individual, it is difficult to adjust his expectations to new benchmarks .

Past performance leads you to form strong opinions and that gives you comfort. Because uncertainty amid danger feels awful, so it’s comforting to have strong opinions even if you have no idea what you’re talking about.


Follow us on Twitter

Quick Connect


No, Thanks

You have Successfully Subscribed!